MS-Ana
Maintained by ppernot
checkRep.R script
This script collects the set of results files generated by analysis.R
as specified in the taskTable and generates figures and statistics.
The peak parameters are plotted as a function of dilu. If dilu
contains the experiment index, checkRep.R can be used to assess the
repeatability of an analysis.
Control variables
The job is defined by a few parameters.
taskTable  = 'files_quantification_2019July10.csv'
quantTable = 'targets_paper_quantification.csv'

fit_dim = 2
userTag = paste0('fit_dim_',fit_dim)

const_fwhm = 0.7
area_min   = 10

makePlots = TRUE
-
taskTable: (string) file path to the list of experiments to be compared -
quantTable: (string) list of the compounds for which the comparisons should be done -
fit_dim: (integer) type of peak fit for which the comparisons should be done -
userTag: (string) tag to differentiate the outputs. In the present case, one wants to compare the repeatability for different peak fit approaches. -
const_fwhm: (numerical) estimate of the peak width in the CV direction to define the plot axes. -
area_min(numerical) should have the same value than used inanalysis.R(only used for reporting in plots) -
makePlots: (logical) generate the plots, or not…
Outputs
Figures
Figures summarizing the set of data for all pairs of species and a summary of the mean values and their uncertainty are generated.
Presently, the plots are generated in the Rstudio interface, but not saved to disk.
Checkrep plot for a repeatability analysis 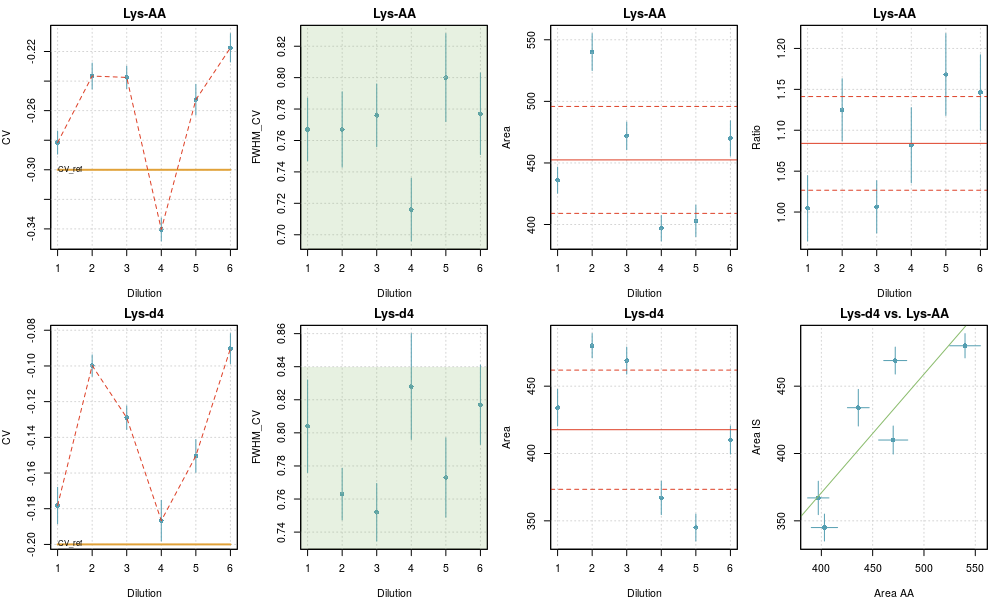
-
The plot reports the fit data (CV, FWHM and Area) for the species (top row) and its tracer (bottom row). The last column displays the calculated area ratios (top) and the correlation plot of the areas for both species (bottom).
-
For FWHM, the green area depicts the limits imposed in the fit.
-
For Area and Ratio, the weighted mean and the limits of a two-sigma uncertainty interval are represented as red horizontal lines, full and dashed respectively.
-
For the Areas correlation plot, the unit line is represented in green.
-
-
For each point, two-sigma error bars are printed in blue.
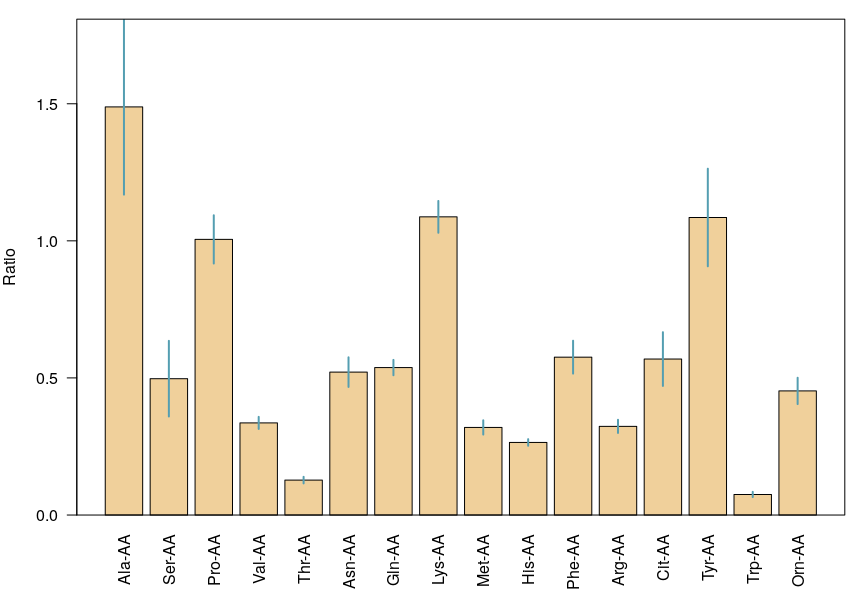
Mean values and uncertainties for a repeatability analysis
Tables
The name of the file is a concatenation of the date, time, userTag,
and ‘_compilation.csv’. It contains all the collected results, with the
following additions:
-
two columns containing the ratio of areas for pairs of compounds defined in
quantTable, and its uncertaintyratio u_ratio -
a set of lines with tag “Mean”, containing for each target compound the mean of the properties over the set of experiments. Weighted means are used, with weights estimated by the Cochran’s ANOVA method [1].
The observed variance is decomposed in two terms: the variance due to the parametric uncertainty on the property (estimated in
analysis.R), and an unknown variance term due to experimental fluctuations (repeatability). The latter is estimated as the observed variance minus the mean of the parametric variances, with a positivity constraint. The variance for a datum is then the sum of its parametric variance and the repeatability variance. The weights are the normalized reciprocal variances [2].
References
[1] C. Rivier et al. (2014) Accredit. Qual. Assur. 19:269–274 doi
[2] Inverse variance weighting in Wikipedia